Look closely at this Bloomberg Commodity Index chart.
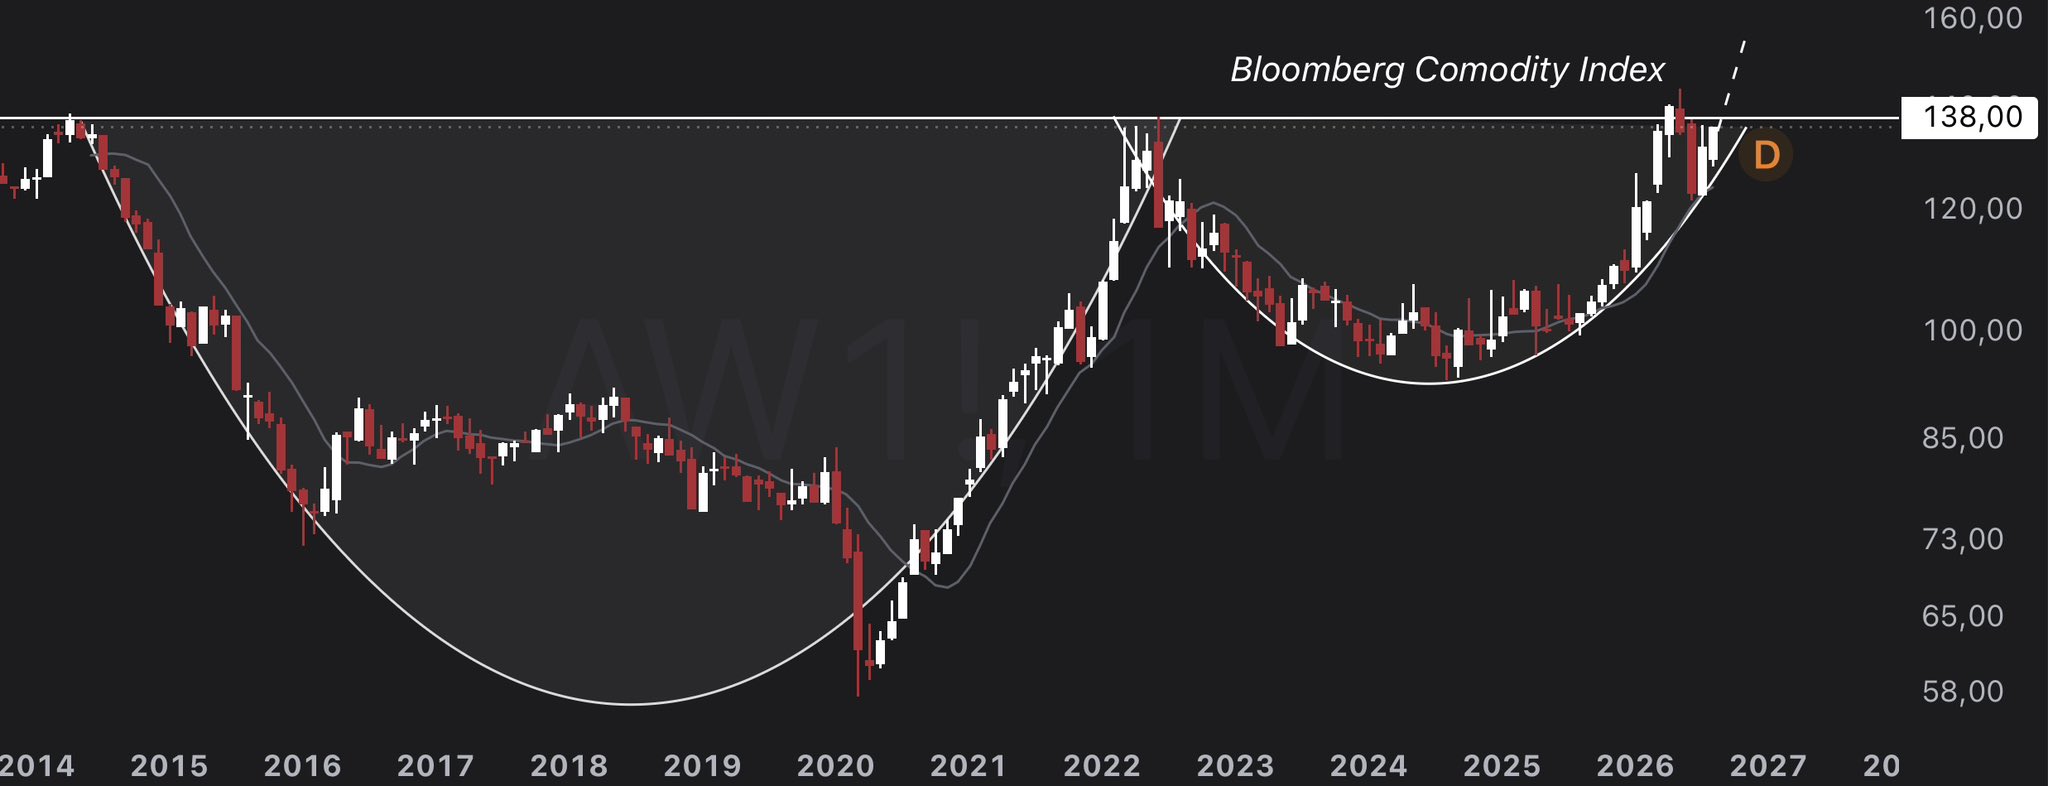
What you’re seeing is a textbook decade+ cup & handle that has been quietly forming since 2014.
The left side of the cup was the brutal 2014–2020 commodity bear market.
The rounded bottom completed during the 2020 crash and subsequent recovery.
Then came the handle – a multi-year consolidation from 2022 through early 2025 that shook out weak hands and built a powerful base.
Now price is preparing to break out above the rim of the cup near 138.
This is not a small pattern. This is a 10+ year base.
⚡️The Silver Parallel Is Impossible to Ignore⚠️
Silver just completed a nearly 50-year cup and handle of its own.
The massive multi-decade base finally broke out above the $50 level in 2025.
What followed was explosive: silver ran from $50 all the way to $121.
That is a 142% move in under 6 months after decades of coiling.
The Bloomberg Commodity Index is now doing a smaller (but still massive) version of the exact same pattern.
Does TA Really Matter?
Cup and handle patterns of this magnitude are rare.
When they resolve to the upside after such long bases, the measured moves are often dramatic.
When they resolve to the upside after such long bases, the measured moves are often dramatic.
Silver’s 50-year pattern delivered a move that many thought was impossible until it happened.
The Bloomberg Commodity Index is now preparing to break out of its own decade-plus version of that same structure.
Commodities as a complex – energy, metals, agriculture – have been suppressed, under-owned, & unloved for years.
This chart suggests the tide is turning against the dollar in favor of ALL THE THINGS in a structural way.
If silver’s post-breakout performance is any guide, the upside that follows a cup and handle of this size can be far larger than most expect.
The pattern is preparing to resolve. Does the breakout come next?