

Submitted by Stewart Thomson, Graceland Updates:
1. The story being told by mainstream media is that because a new Fed boss will supposedly keep its decision making independent from that of the US government…
2. Gold needed to fall $1200/oz and silver needed to fall $50!
3. In a nutshell, the story being told is… 100% nonsense. 
4. Fiat is best described as meme or junk money, but as pathetic as it is, there will still be occasional rallies against supreme money gold.
5. These rallies usually happen when there’s a bit of speculative froth in the market, and that’s been the case for the past couple of months.
6. Fundamentally, the gold bull era is 100% intact. Three billion gold-obsessed citizens of China and India (and a small band of savvy Western gold bugs) don’t need central banks, because their focus is on building glorious savings in gold rather than adding more fiat and debt.
7. In the big bull era picture, it doesn’t matter which “fiat freak” runs the Fed. All that matters is whether gold is on sale or not, and if it is, savvy citizens need to eagerly get more.
8. I urged gold bugs of the world to prep to buy the $4400 zone on a decent dip into it, and that sale has finally occurred.
9. Building wealth that is sustained requires a focus not on price prediction, but preparation for surprise. This price sale took place over just a few days, and investors who had done no preparation to buy it are now confused and still trying to predict what comes next.
10. The big news is that the $5600 area has now become a massive buy zone itself… on a future price sale into it. All gold bugs should be prepping now to buy that event if/when it eventually occurs.
11. The silver price sale was “super sized” due to the large and highly leveraged bets against fiat, but it ended at the buy zone of $70, which is in perfect sync with gold arriving at $4400.
12. Gold is the lord and master of the metals market house. If silver and mining stock bugs follow the lead of their gold bullion master, they will build mindboggling wealth that can be sustained. The most likely scenario for silver now is a range trade between $120 and $70, and then a fabulous upside breakout that should see it surge to my next target zone of $170-$200.
13. Ultimately, silver should trade above $1000, mainly because the fiat and debt-obsessed governments of the world (both in the East and the West) will continue to refuse to replace their hideous fiat monies with gold. 
14. A 40year inflation cycle began in 2020 and it likely won’t end until US rates are at all-time highs. Unlike the resolution of the cycle in 1980, this time those high rates won’t work to halt the inflation the governments are creating. 
15. The new Fed boss is more likely to impose restrictive policy on the debt-crazed US government than hand out free QE candy bars and rate cut cake. That will affect the long-term rates of governments around the world, and global money managers will eagerly continue their savvy trek into gold!
16. As rates rise relentlessly in the coming years, governments will have to face their “Queen Gold maker”. They’ll have to begin replacing their pathetic fiats with gold, or be de facto annihilated.
17. Robots? They will become just another expense for stagflation-impaled citizens and… as the population of robots begins to grow dramatically (and eventually outnumbers humans), citizens of the world will find themselves competing for a limited number of jobs. Facing government-oriented stagflation headwinds with no savings in gold, these citizens will experience extreme financial hardship, and a stock market crash will only add to their pain.
18. What about the miners? Well, they were also spectacular buys at gold $4400, and for a solid look at them: 
The CDNX is beginning to break out of its ten-year base pattern, and the price action is similar to when gold broke above $2000:
- The initial surge looks false, but it’s real. That’s because the breakout is more of a process than a short-term event. Note the enormous volume coming into the CDNX stocks.
- While there was some froth in the gold and silver bullion market, there was and is none in the miners. Some silver explorers that are getting ready to move into production have a potential AISC of well under $20 and gold explorers with big projects are sporting an AISC of under $2000. The bottom line: Junior gold and silver miners are the most undervalued sector in the history of markets!
- Junior mine stock investing isn’t for everyone, especially with size, but as this gargantuan gold bull era rollout continues, these miners look set to outperform everything!
- What about the seniors?
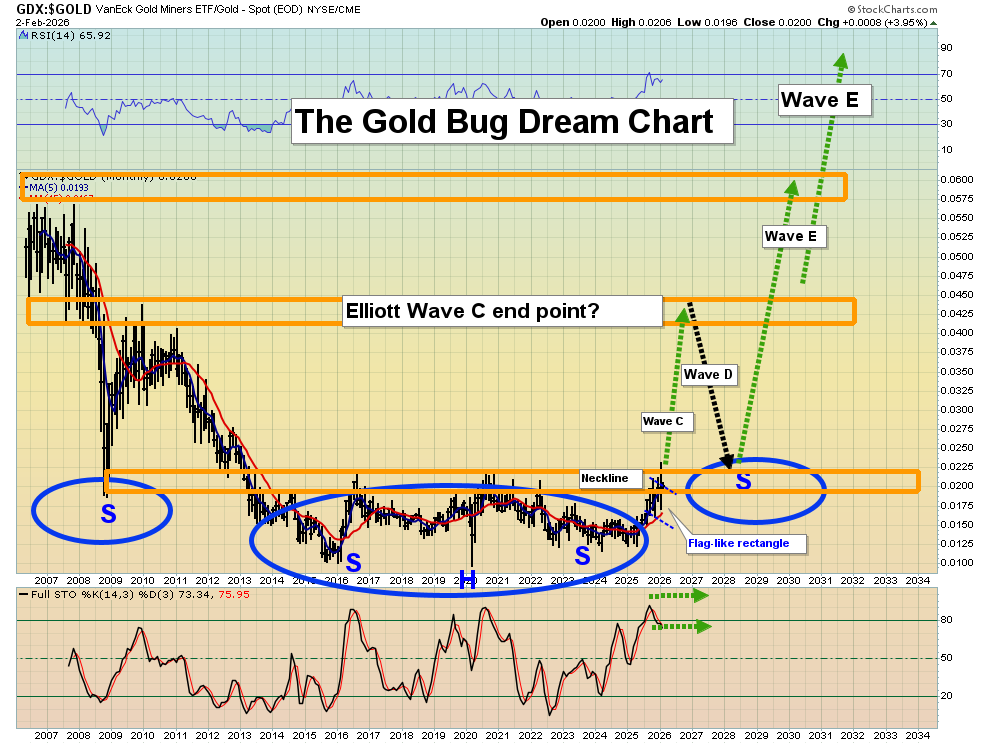
Double-click to enlarge this mindboggling GDX versus gold chart. I’ve been walking investors through the action since the 2015 low. That low began to define the head of the massive inverse H&S pattern. It suggests not just years, but decades of good gold stock times lie ahead. In sync with the CDNX vs fiat chart, the breakout process has begun!


23. The most recent five-wave advance was spectacular… and a new one could already be underway! Excitingly, the pullback for GDX ended well above its October highs, while gold pulled back to them. That’s a powerful sign that more bullish action lies ahead.
- While gold could range trade between $5600 and $4400 and silver between $120 and $70, GDX and most of its component stocks could surge to fresh highs! I’ve noted that 2026 is the Chinese year of the fire horse, which is associated with citizens taking bold action and fighting for freedom. Are gold and silver stocks set to get that same kind of bold action and freedom… the freedom to surge to incredible new heights? I’m going to suggest that they are!
Thanks!
Cheers
St


