


Submitted by Stewart Thomson, Graceland Updates
1. Did the US government just win their debt-funded war with the Iranian government or… did they just lose it?
2. Well, from the somewhat macabre perspective of mainstream investors, it really doesn’t matter which government won or lost.
3. What matters is whether the war is ending or continuing, and the perception is now that it’s ending.
4. 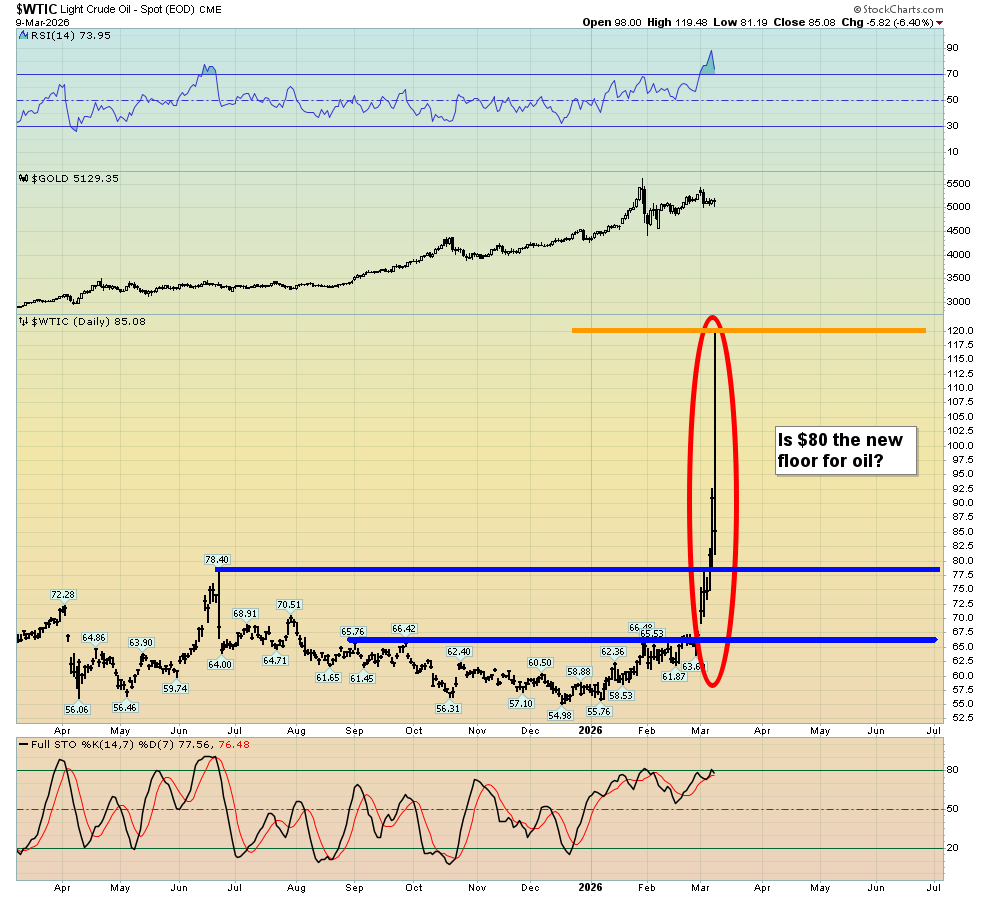 Oil almost doubled in price… in just one week!
5. Incredibly, as oil skyrocketed, some mainstream pundits demanded the Fed (America’s fiat money soup kitchen?) cut rates to halt the sell-off in their precious stock market, gleefully ignoring the danger of igniting a parabolic surge in inflation.
6. The government panicked in October when the tariff tax-oriented stock market selling wouldn’t stop and so they cancelled many of the new taxes… halting the dip.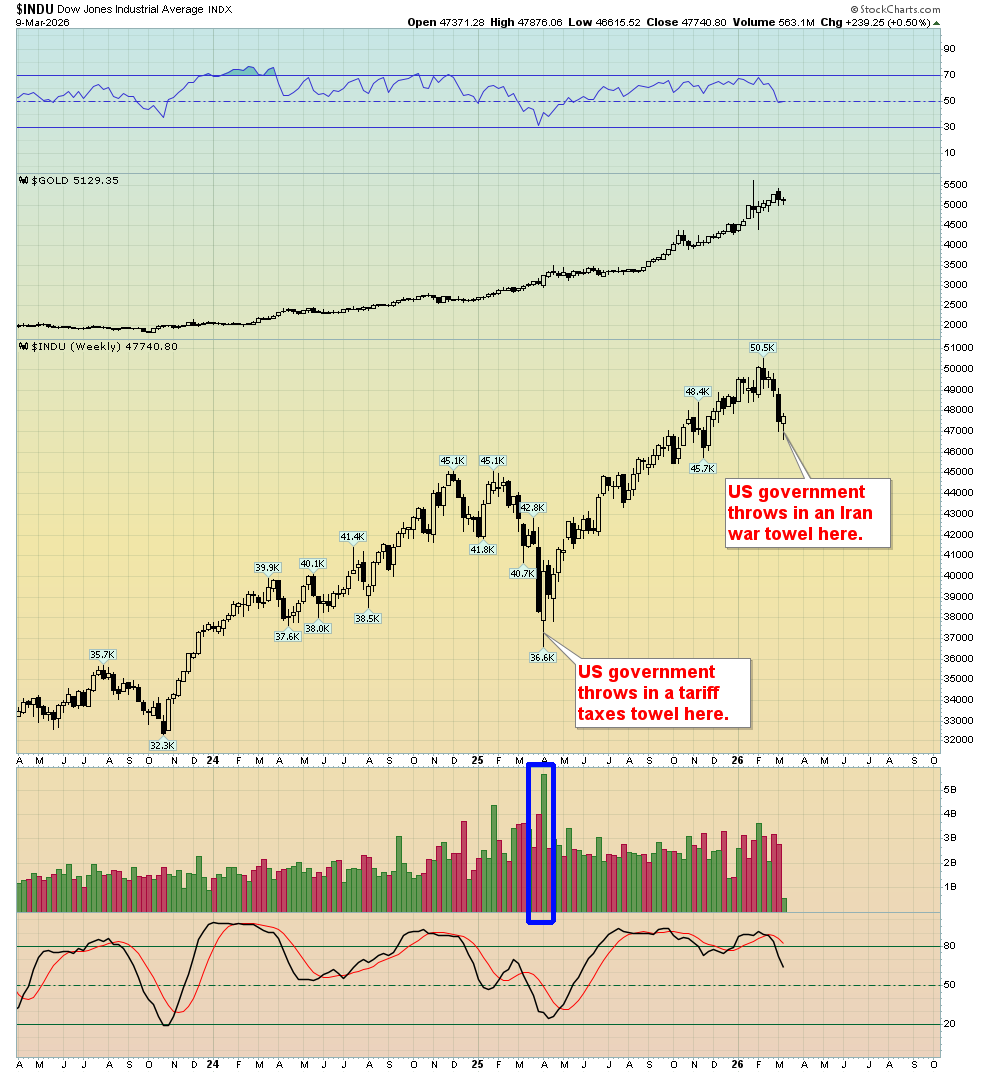
7. The same government just panicked again, after spending the weekend boasting about potential US boots on the ground (more US soldier deaths) and demanding unconditional surrender from the Iranian government, which was met with no surrender at all, and the appointment of a new ultra-hardline Ayatollah.
8. Hours later, the war was announced to be “almost over”, and oil prices are of course retreating. That’s given frightened stock market investors some respite but…
9. The problem the US government faces is that the nation’s stock market is still outrageously overvalued.
10. To make matters worse, jobs growth has turned negative after being almost flat for all of 2025, the latest PPI report shows inflation is skyrocketing (even before oil began to surge), private sector GDP growth is anemic, and the government’s war spending is again increasing its already-outrageous debt.
11. I suggested that for the market to really break down, the ADL (advance/decline line) needed to close under 553. 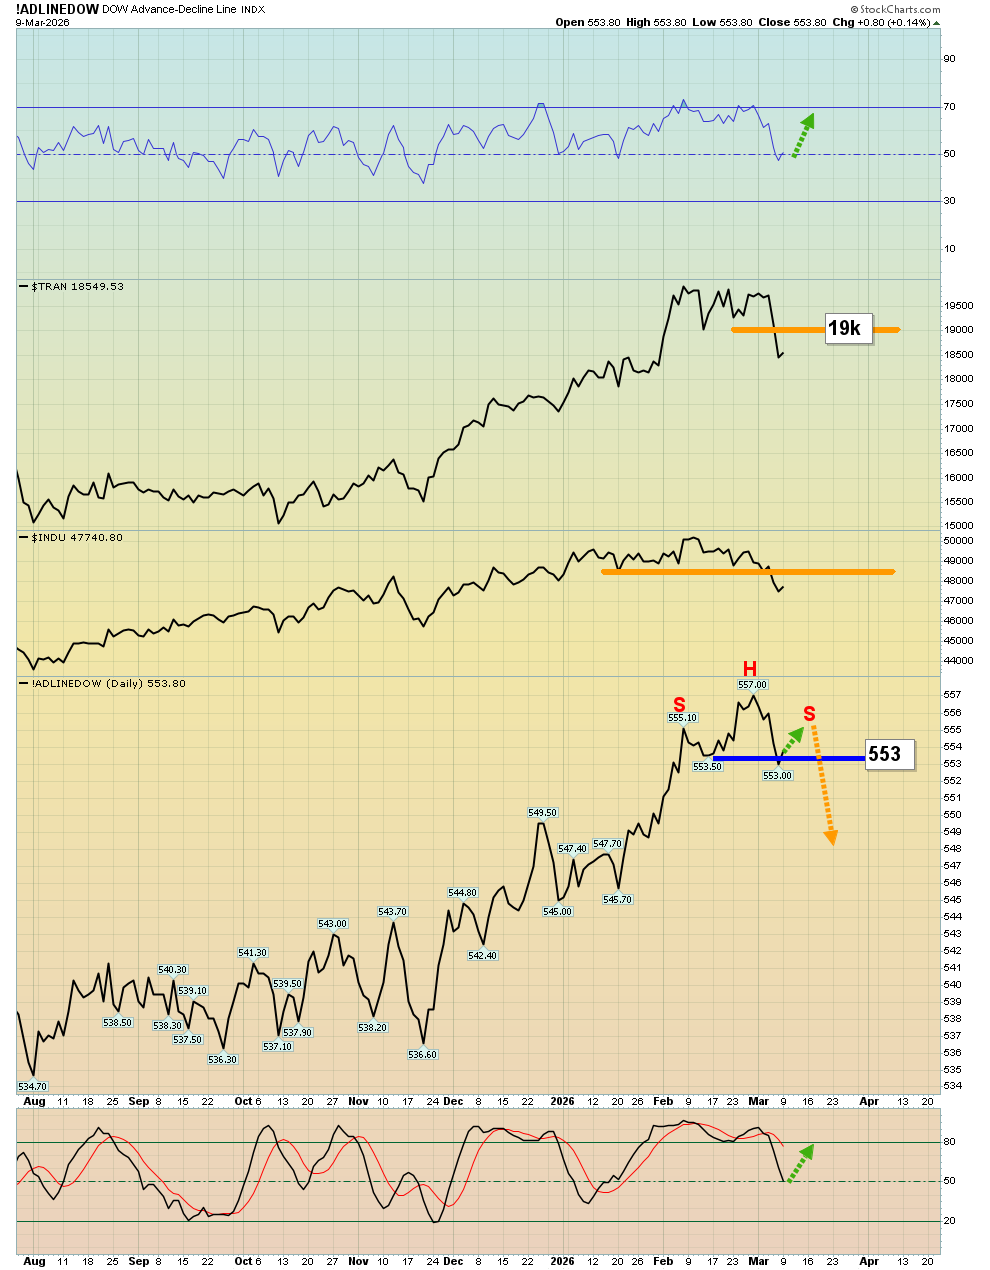
12. That hasn’t happened… yet. Note the potential H&S top in play on the ADL; 553 is still a big number to watch.
13. Gold? 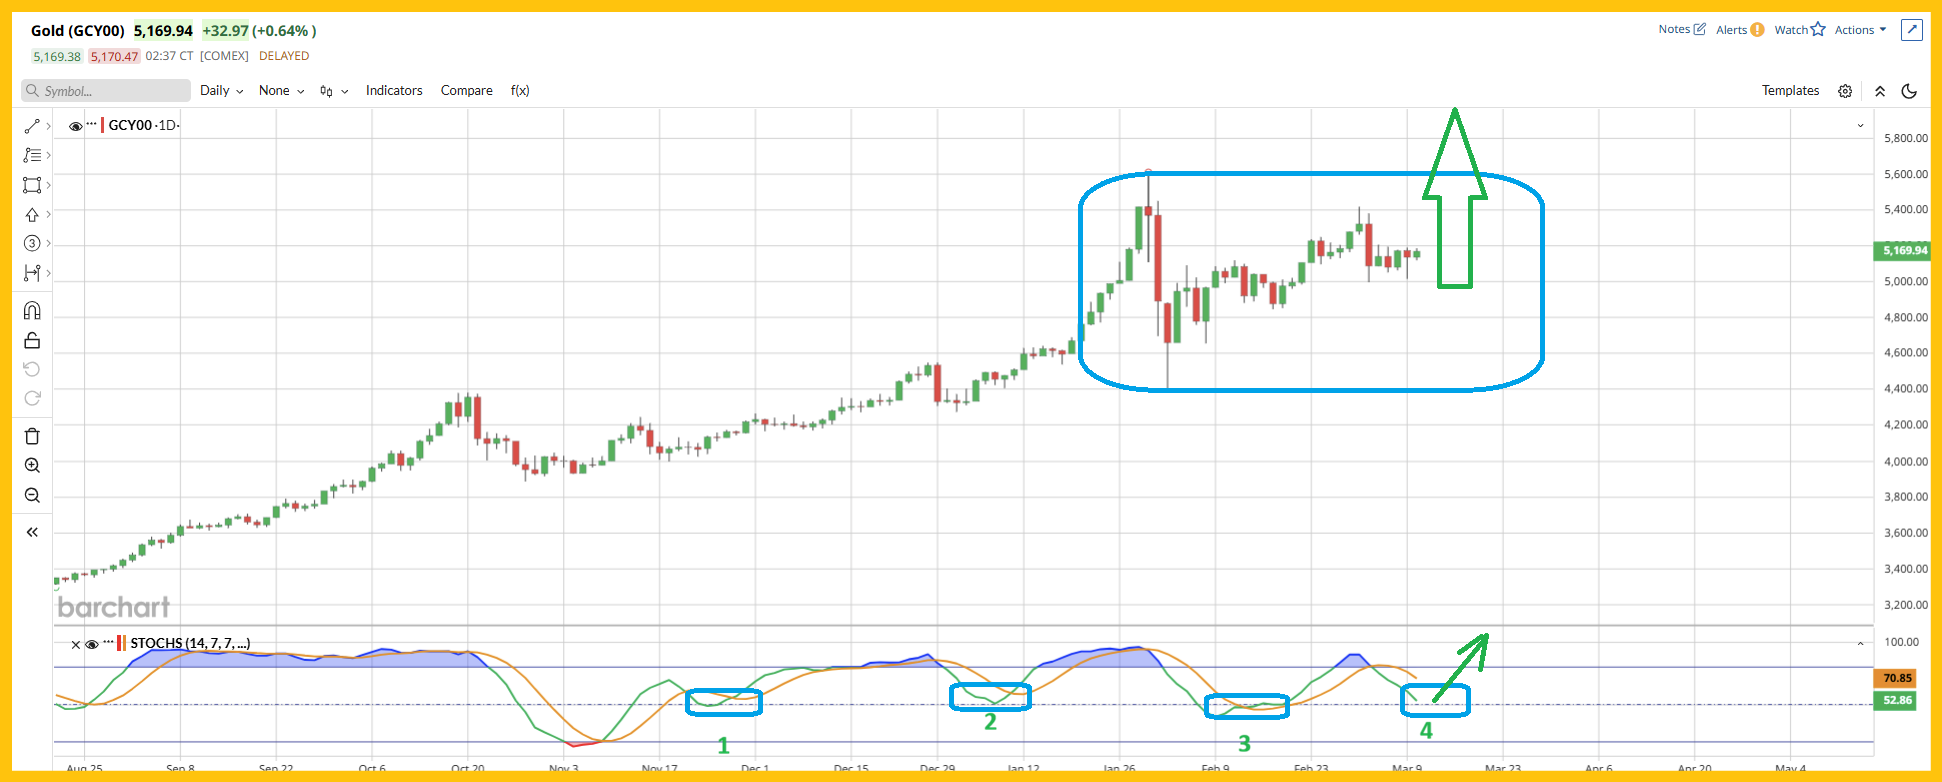
Gold was trading in a loose $4400-$5600 range before the war, and nothing has changed since the war began.
14. I urged gold bugs of the world to buy modest gold, silver, and mining stock positions at $5100. That’s proved to be a solid support zone for the price. Note the fourth touching in the momentum zone (about 50) for the key Stochastics (14,7,7 series) oscillator. It looks like a move to above $6000 (and probably to $6600) could be next.
15. While the Western fear trade will affect the short-term price action for years to come, the bulk of gold price discovery is moving East. 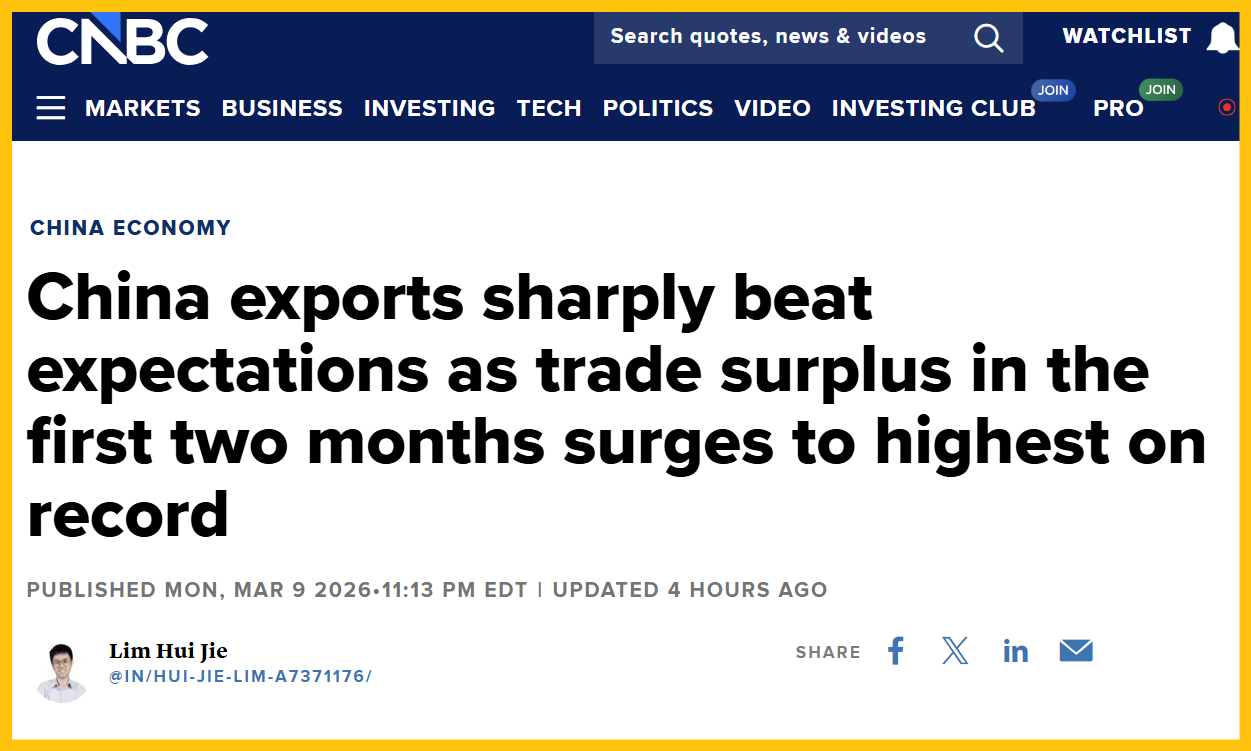
16. In the West, investors throw silly tantrums and sell gold aggressively when there’s good economic news. In contrast, in the East, good news is celebrated and gold is correctly recognized as the world’s greatest money that needs to be continuously accumulated. The sheer size of the population of the East ensures that a new “ultimate trade” for gold will be the main driver of demand… and price discovery.
17. What about the miners? 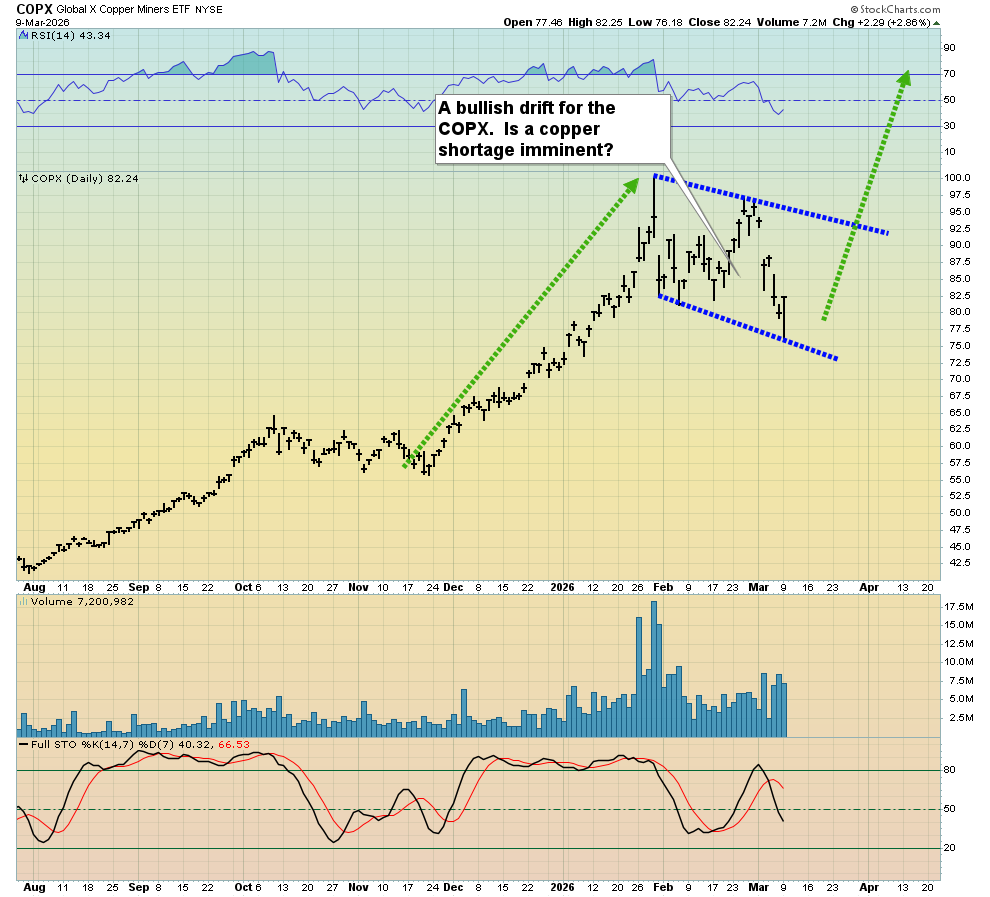
A 25% price sale is taking the form of a bullish rectangular drift. If the US government hadn’t faded its Iran war yesterday, oil would be charging towards $200 right now.
18. Just as companies and governments began moving away from the US dollar as it was weaponized, they will move more aggressively away from oil and towards electric cars, robots, AI, and drones…
19. All of which require enormous amounts of copper.
20. I’ve urged eager mine stock investors to be open to a short-term pause on this CDNX weekly chart… and that’s in play. 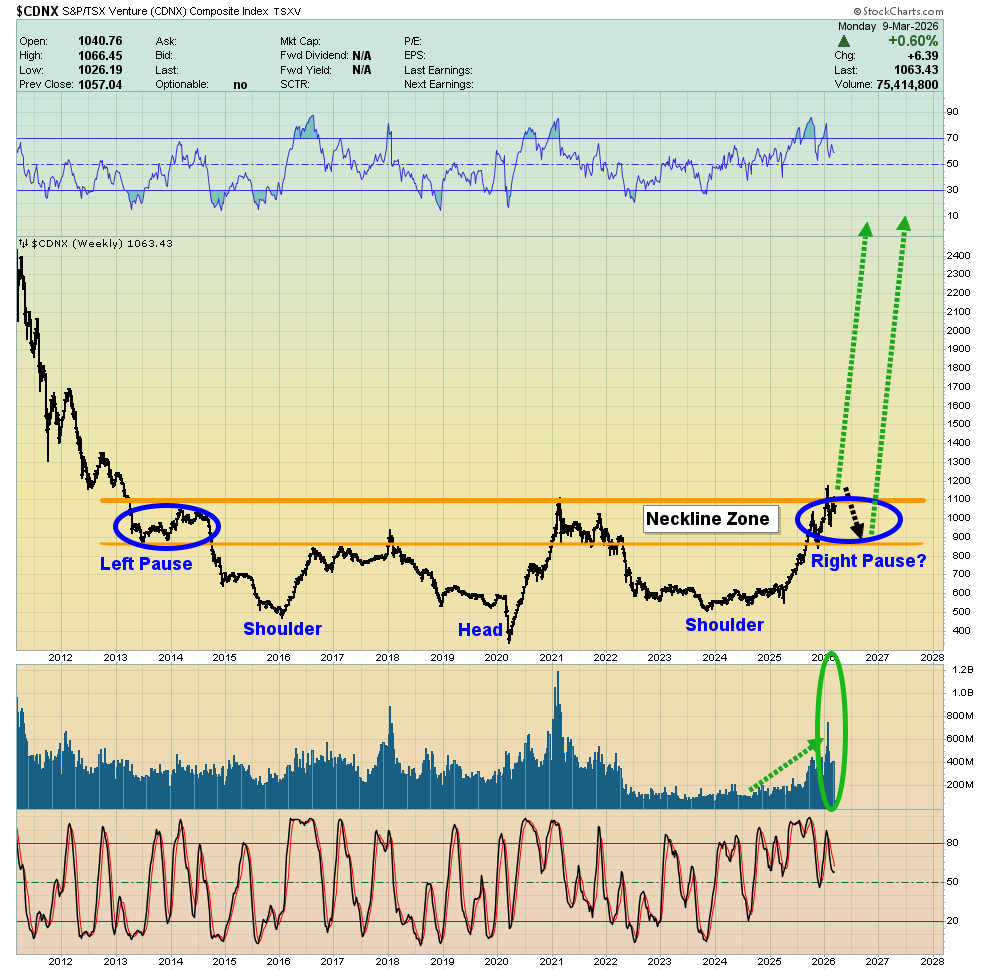
The positive daily chart action suggests that the pause could be ending… and one of the most glorious breakouts in the history of markets could occur!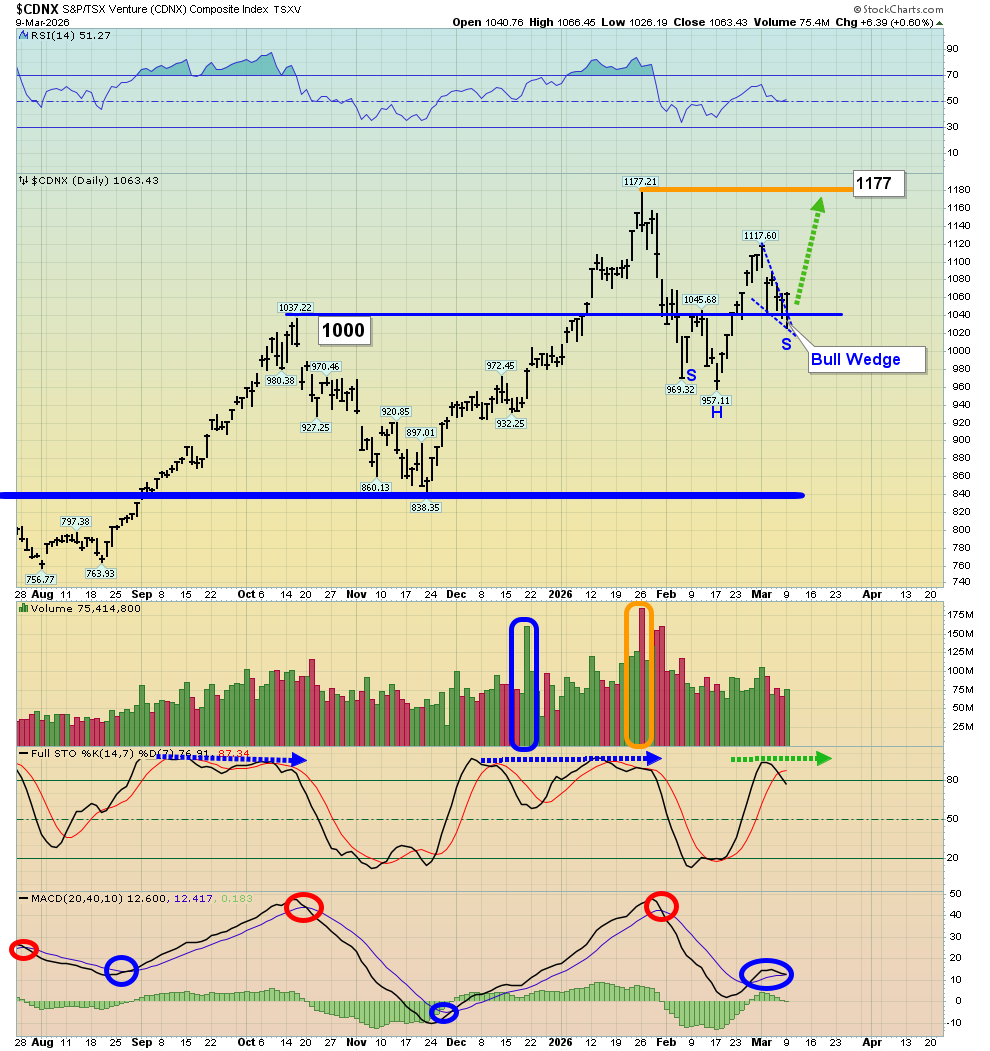
21. Junior mine stock investing isn’t for everyone, especially with size, but as this gargantuan gold bull era rollout continues, these miners look set to outperform everything!
22. Another one of the greatest charts in the history of markets, the GDX versus gold chart. 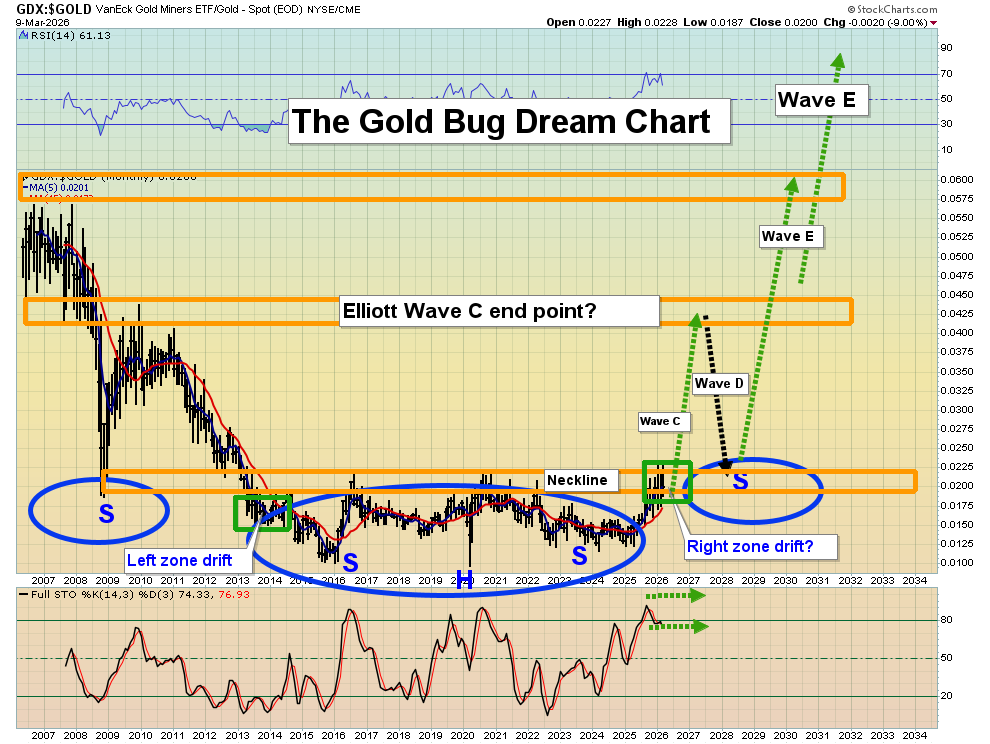
The predicted pause at the neckline of the massive inverse H&S pattern continues to be in play. I’ve suggested that the “true” breakout may not occur until later this year but there’s too much at stake in terms of potential upside to try to top call gold stocks here.
23. On this daily chart of GDX versus US fiat money, the pause didn’t begin until late January. 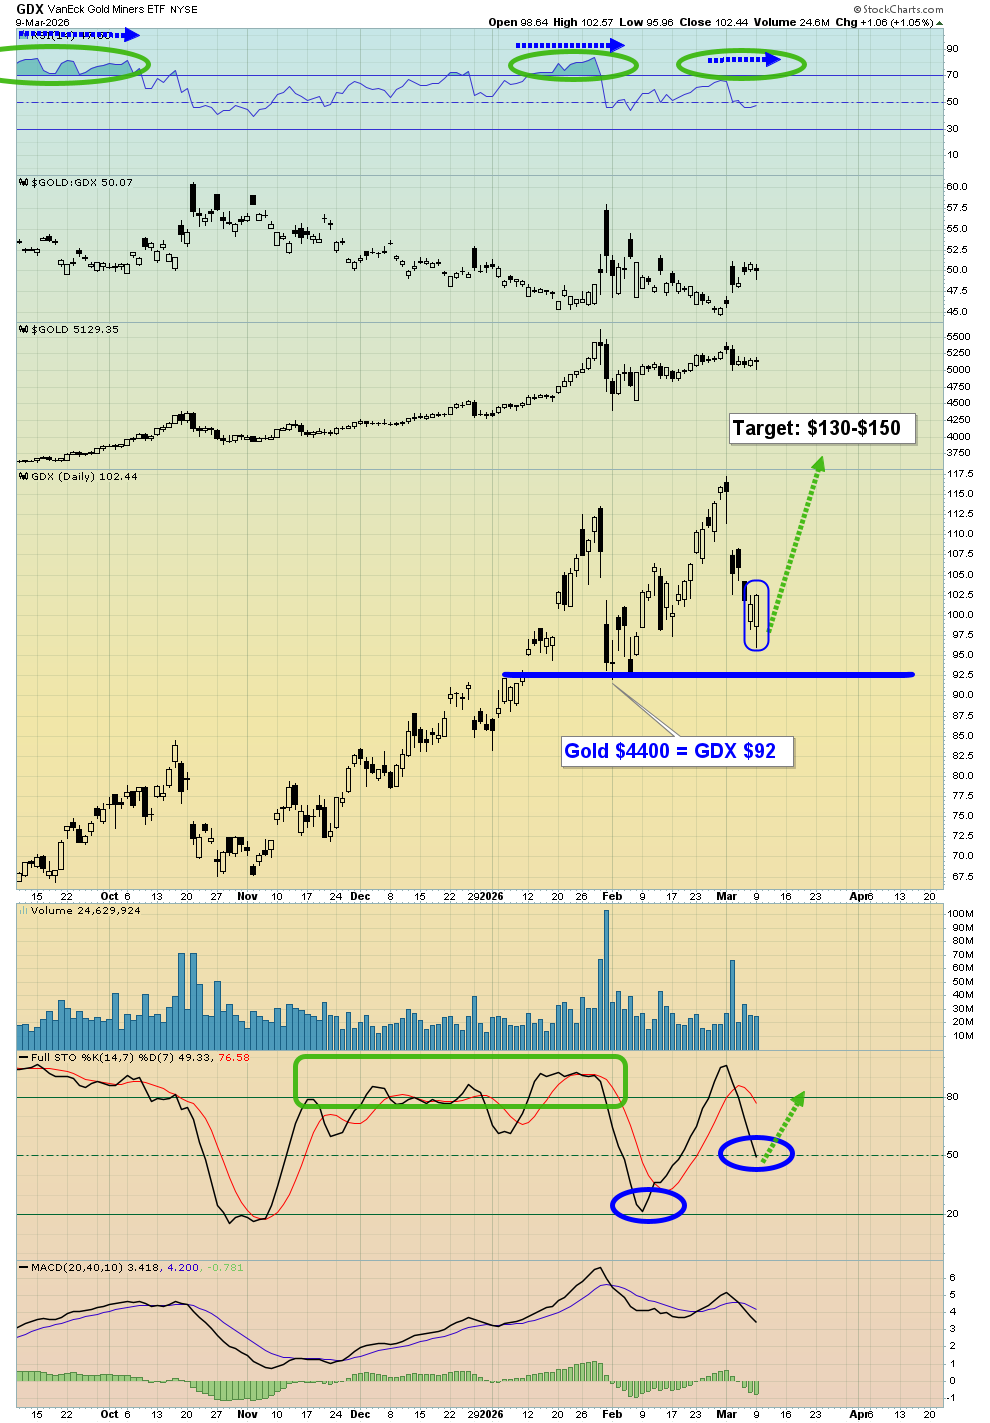
A surge to $130 is likely to occur within the big GDX versus gold pause zone and…
24. When that pause ends, money managers will probably be exiting the stock market in a stagflation-oriented panic. GDX likely then rallies to $300 and gold goes to $10,000. In a nutshell, it’s the greatest time in history to be a gold, silver, and mining stocks bug. Investors are poised to get all the upside from the fear trade in the West, and all the backing they need to confidently buy dips, from three billion savvy metal bugs in the East!
Thanks!
Cheers Stewart Thomson
Galactic Updates


